R · quantmod · PerformanceAnalytics · 2025
Overview
Question: Would a US 60/40 portfolio (SPY/BND) have been "better" than holding VT? I compare VT buy-and-hold against SPY/BND 60/40 under three policies: buy-and-hold (no rebalancing), monthly rebalancing, and yearly rebalancing.
Key takeaways (v1)
VT is a higher-risk equity-only benchmark; 60/40 is expected to reduce volatility and drawdowns.
Rebalancing frequency changes results slightly (gross of costs).
"Better" depends on objective: maximising ending wealth vs reducing drawdowns vs improving risk-adjusted returns (Sharpe).
Notes: Sharpe is computed with Rf = 0. This version does not include transaction costs or taxes.
Results
Annualised metrics (gross; Rf=0; no transaction costs/taxes in v1).

Performance summary (growth of 1, drawdowns, and return distribution).
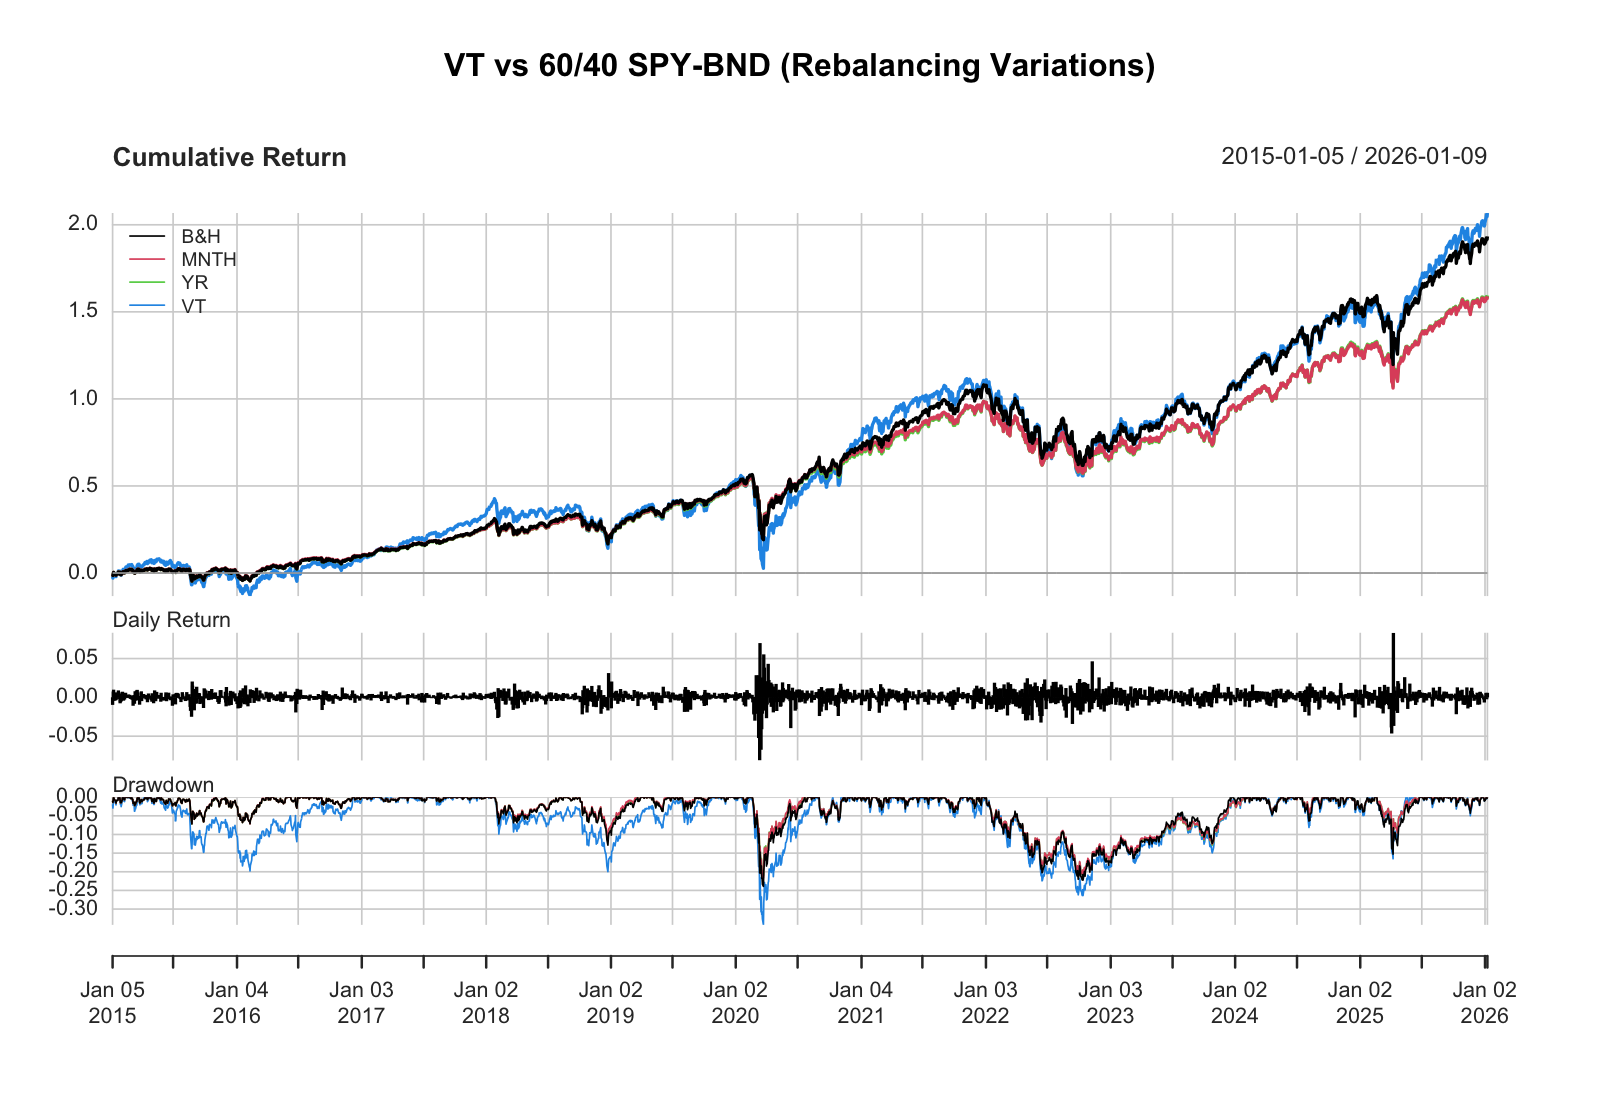
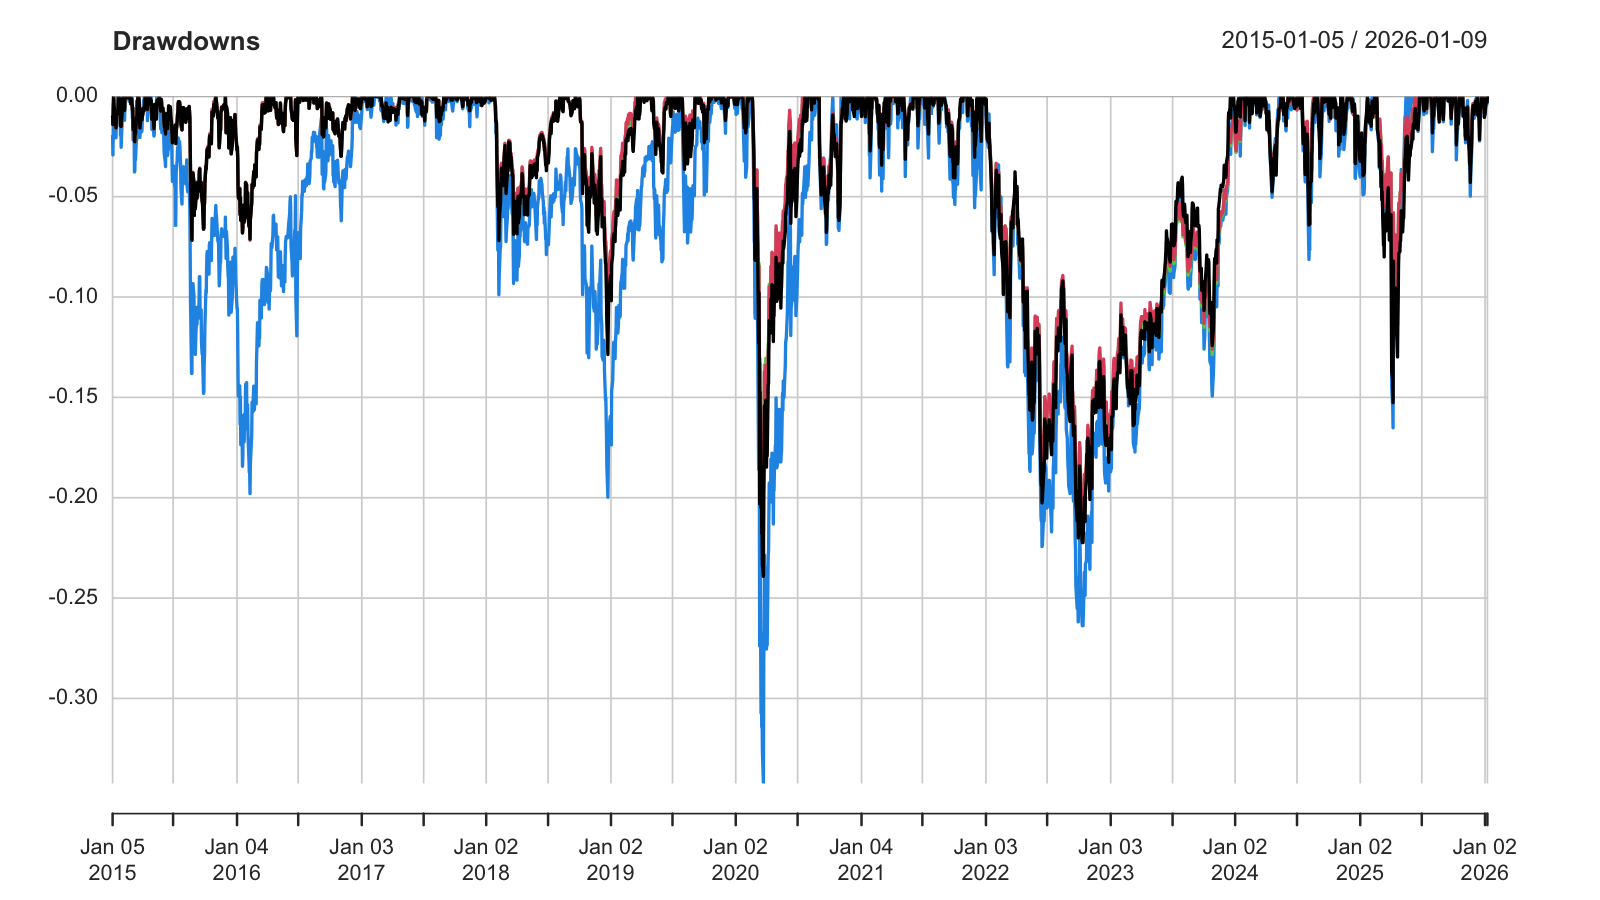
Drawdowns (depth and recovery) are often the most decision-relevant risk view.
Method
- Data: Yahoo Finance adjusted close for SPY, BND, VT.
- Returns: daily simple returns using
ROC(..., type="discrete"). - Portfolios:
Return.portfolio()on SPY/BND returns with weights (0.60, 0.40). - Rebalancing policies: buy-and-hold (drift), monthly rebalance, yearly rebalance.
- Metrics: annualised return, annualised volatility, Sharpe (Rf=0), and worst drawdown.
Planned for v2: excess-return series (portfolio − VT), turnover estimation, and a simple bps cost model.
Limitations
- No transaction costs/taxes: rebalancing frequency conclusions may change net-of-cost.
- Rf=0 simplification: Sharpe ratio will differ with a realistic risk-free rate.
- Sample dependence: outcomes depend on the chosen time period and market regime.
Tags: R · Portfolio analytics